Enter your email address below to get a free copy of the Pinterest Performance Tool (PPT)
Whether you have a blog or an online business, chances are you’re looking at social media to drive traffic to your website and attract customers.
Pinterest is a fantastic platform because the lifespan of your content is much longer compared to other social media platforms. This extended visibility makes it an excellent choice, especially for beginners. That’s why it’s important to implement an effective Pinterest marketing strategy to maximise your reach and engagement.
The Need for Better Pinterest Analytics
A key part of a strong Pinterest marketing strategy is knowing what’s working and what’s not. Pinterest analytics provides some data, but as an experienced data analyst, I found it insufficient for truly understanding pins performance.
Pinterest gives total impressions for each pin and ranks them accordingly. However, comparing the total impressions of different pins without considering their age can be misleading.
For example, if your top pin (let’s call it Pin 1) has 200 impressions and your second top pin (Pin 2) has 50 impressions, you might think Pin 1 is better. But if Pin 1 was created six months ago and Pin 2 just yesterday, Pin 2 is actually performing better.
To address this, I created an Excel tool that adjusts the data to account for pin age allowing for a true comparison of pins. This tool helps me make informed decisions about which content to focus on. Realising its potential value to my readers, I’m sharing my Pin Performance Tool (PPT) for free.
In this article, I’ll guide you on how to use the PPT with your own data to make better content decisions. Let’s dive in!
How to Get Your Copy of the Pin Performance Tool (PPT)
To get started with better Pinterest marketing, download your copy of the PPT using the form at the top of this article. Simply enter your email address and click “Download Now.” You should receive an email almost immediately (check your junk folder if it doesn’t appear within a few minutes) with a link to download the excel file. Click the link to save the file to your device.
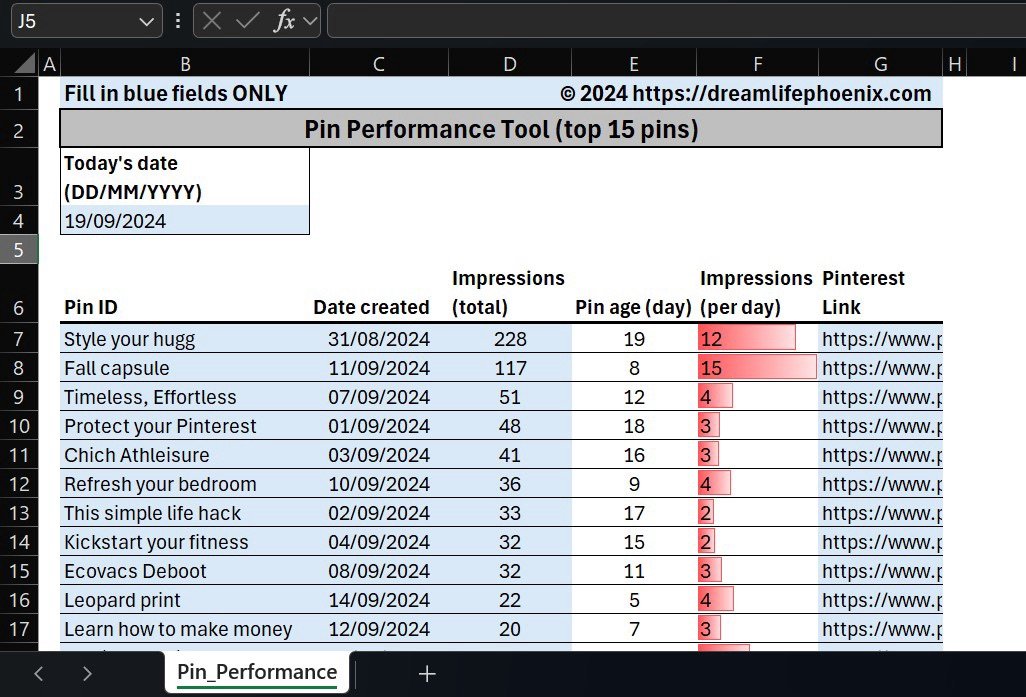
In the image below, you can see what the tool looks like. You’ll need to fill in only the blue sections using your own data. Some example data is included for your reference, but I’ll walk you through how to obtain your input data for the tool.

Pin Impressions
You can get this information from the data export available on the desktop version of Pinterest. To access this data, navigate to “Analytics overview” and click “Export” in the top right corner (see highlighted in red below).

An excel file similar to the one shown in the image below will be downloaded to your Downloads folder.
Focus on the “Top Pins” data, which in the example starts from row 57 of the spreadsheet (highlighted in yellow). Copy everything under the columns “Pinterest Link” and “Impressions” (both highlighted in red) and paste into the corresponding columns in the PPT.
Pinterest identifies pins by their URLs (Pinterest Link), but I find it easier to use descriptive IDs to clearly see which pin I am analysing. I generally use the first three words of the pin title, as all my pins have unique titles, but you can use whatever method suits you best. This is what you’ll find under the heading “Pin ID” in the PPT. I keep the pin URL in the tool for future reference and safety, as it provides an additional way to identify a pin. Clicking on the URL should open the pin directly.

Pin Creation Date
The last piece of information you need for the PPT is the creation date of each pin. You can find this in the Analytics Overview under the Top Pins section. Simply hover over a pin, and a zoomed-in version of the pin will appear, displaying the creation date at the bottom (highlighted in yellow in the example below).

Enter the creation dates for all your pins in the “Date Created” column of the PPT. Make sure that each date matches the corresponding Pin ID correctly.
Don’t forget to enter today’s date in cell B4, so the tool can calculate the age of each pin.
Interpreting Pin Performance Tool Results
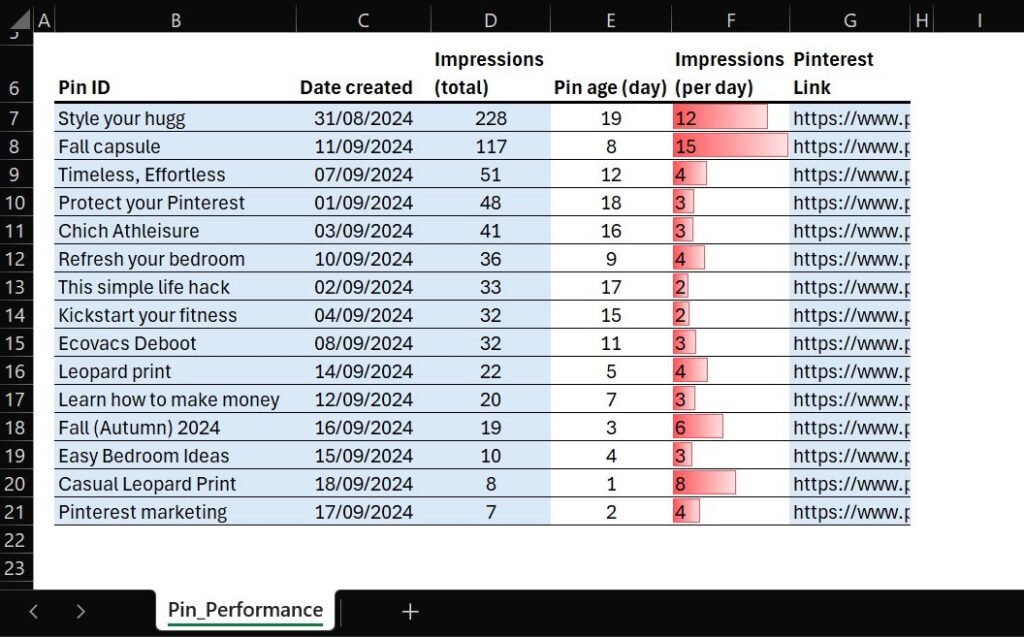
The impressions adjusted for pin age will be displayed in the “Impressions (per day)” column (column F). In the context of a Pinterest marketing strategy, Pins with higher daily impressions are your top performers.
Red data bars within the cells provide a visual indicator of pin performance, with longer bars representing higher-performing pins. For example, although the “Style Your Ugg” pin has nearly double the total impressions of the “Fall Capsule” pin (228 vs. 117), the “Fall Capsule” pin is actually gaining more impressions per day (15 vs. 12), making it the better performer.

Conclusion
I hope the Pin Performance Tool proves valuable in refining your Pinterest marketing strategy and helps you identify the content that truly engages your audience. If you found this article useful or have any feedback or questions, please feel free to share them in the comments below.
Alla prossima!

